The Marketplace Equation
All businesses hit a plateau. Growth stalls. Revenue and usage curves start to flatten. For some businesses, this happens pre-product-market fit, some right after, and others at scale. Sometimes it’s a function of uncertain macroeconomic conditions. Sometimes it is intrinsic to the product or the business model. It’s inevitable.
Marketplaces are particularly susceptible to this because of their fundamental reliance on network effects. Hard to scale demand and supply in lockstep and consistently create a magical experience for buyers and suppliers.
Marketplaces that successfully emerge from a plateau with growth, have a crisp understanding of their business levers driving their Marketplace Equation.
This post discusses the key levers of the Marketplace Equation and examples of how scaled marketplaces have used these levers to grow.
Lever 1: Supply Size
The first lever is supply size. Number of sellers or service providers on the platform. This is usually the most important lever driving the marketplace’s quality and buyer experience. More suppliers means buyer’s always have options to choose from. Usually leads to a higher match rate. Which, in turn, leads to a transaction and ultimately drives revenue. A second order effect is that a higher supply leads to healthy competition, leading to an improvement in quality and pricing. If I can consistently get high quality goods at market leading prices from quality vendors - I am more likely to continue using the platform as a buyer. In fact, if my experience is truly delightful, I am going to tell my friends about it.

How Etsy Optimized Supplier Size to drive growth
Etsy is an online marketplace that focuses on handmade or vintage items, as well as art and craft supplies. The company was founded in 2005 and went public in 2015. Etsy operates on a commission-based business model, taking a percentage of each transaction that occurs on its platform.
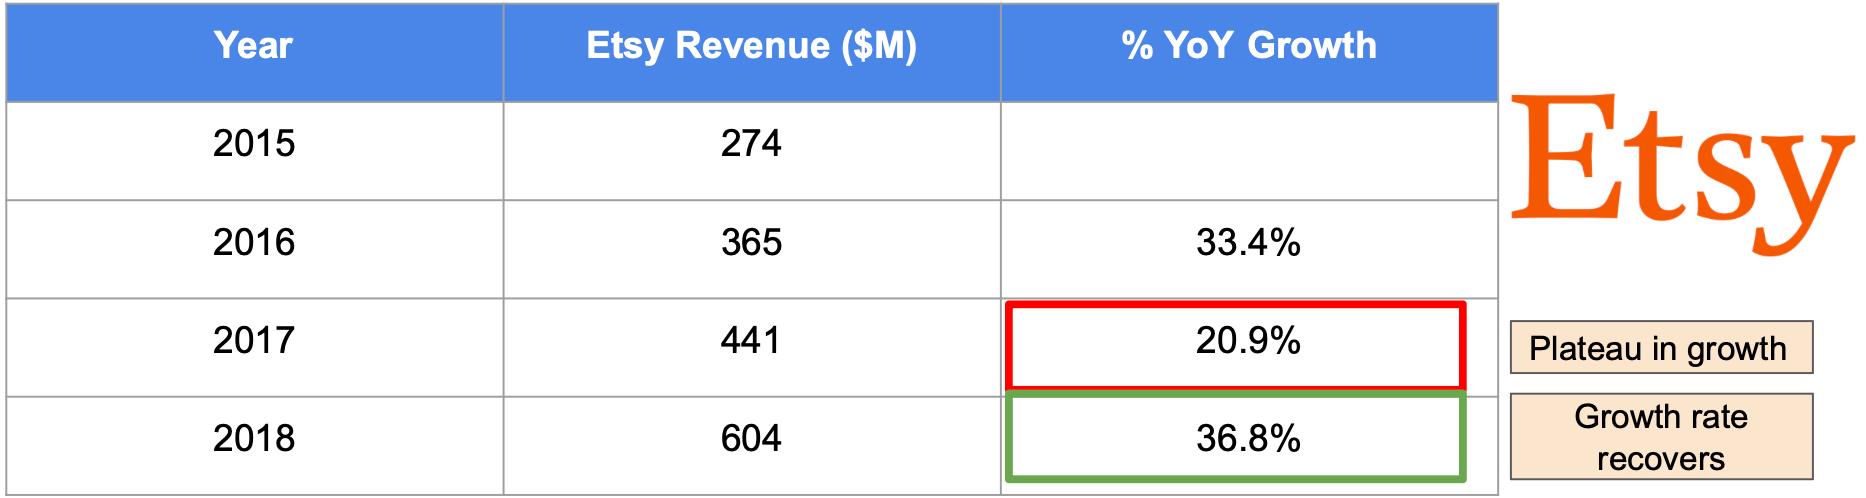
Etsy faced a period of stagnation right after they went public. Revenue growth sharply declined from 40% in 2015 to 21% in 2017. As a result stock price declined as much as 60% and ended 2017 down 40% from their highs in 2015. At the time, management attributed this rapid plateauing to a decline in the number of active sellers on the platform. It had become too complicated to use.
In response, management made serious investments to optimize this key lever to increase supply size. The most notable were its investments in the Seller Education program and improvement in search. Etsy created dedicated resources such as webinars, tutorials, and workshops to improve seller retention and on-platform success. In addition, it served as a smoother on-ramp for new sellers interested in selling on Etsy. Furthermore, improving search capabilities enabled these sellers to be found more easily for their products. More new sellers on the platform after learning how to sell, existing sellers learning how to be more successful on Etsy, and improved search driving traffic lead to happier, higher quality sellers.
The result? Etsy started growing more rapidly again and returned to pre-plateau levels.
This Etsy example highlights the importance of supply size as a lever, and a demonstration of how appropriate investments to optimize this lever leads to marketplace growth out of a plateau.
Lever 2: Match Rate
The second lever is the Match Rate. The ultimate goal for both buyers and sellers on the platform is to consummate a transaction. Buy something. Sell something. The platform’s job is to appropriately match buyers and sellers to complete a transaction. More transactions leads to more revenue, happier sellers (they made money), and happier buyers (they got the product / service they were looking for).

Uber’s hyper local match rate problem
The classic example of the match rate problem is Uber. When Uber launched in any new geography, match rate was their first problem. It just took too long to match a rider with a driver. Long wait times led to a poor customer experience.
To fix this, Uber invested in a few major initiatives. First, dynamic pricing to incentivize drivers to drive at high need times. Second, they created new driver incentive programs - rewards, minimum monthly payments etc. to increase driver activity. As much as we hate rising Uber costs and ugh Surge pricing, these initiatives led to a significant decrease in wait times for passengers due to a MUCH faster and better match rate.
Lever 3: Revenue per Transaction
After talking about increasing sellers, and matching buyers and sellers better, a third key lever is enabling buyers to spend more per transaction. Who doesn't want more money for the same amount of work (of acquiring buyers and sellers)?
My favorite example for this lever is Amazon.
An Amazon Experience
In the early 2000s, Amazon was facing a plateau in its growth. Instead of increasing take rate to increase revenue, Amazon focused on upsells and cross-sells to increase revenue per transaction. One key initiative was the "Customers Who Bought This Item Also Bought" feature, which recommended related products to customers based on their previous purchases. By simplifying bundling, Amazon increased average order value per transaction. This was so effective that in 2006, 35% of the company’s total revenue was from cross selling (1). But that’s not all. Amazon also launched a free-shipping threshold. Buy more stuff to get free shipping. This also contributed to an increase in AOV and revenue per transaction as customers chased after free shipping.
Lever 4: Take Rate
The final lever of the marketplace equation is take rate. This is the percentage of the total transaction that goes to the marketplace as revenue. Marketplaces have a wide variance of take rates. As a rule of thumb, Marketplaces with low AOVs, commoditized goods, or high competition have lower take rate. Etsy, for example, charges only 6.5% of the transaction. On the other end of the spectrum, Amazon charges between 15% - 45%. I haven’t seen many marketplaces successfully increase their take rate without intense user pushback. However, once a marketplace establishes dominant market position and builds customer behavior lock-in, take rate as a lever becomes more viable.

Ebay's Annual Take Rate Hike
While many marketplaces have done this over the year, Ebay is a prominent recent example of a scaled marketplaces turning to the take rate lever for growth. In 2022, as part of their annual announcement to sellers, Ebay increased take rate by 0.3% in several categories, as well as bumped up the fixed fee dollar amounts for things such as subtitle upgrades. In 2023, again Ebay increased their take rate by another 0.35% across most categories. The rationale for this maneuver is clear. The company is suffering from a continued multi-quarter contraction. As GMV leaks away to other verticalized marketplaces, one way to keep their head over water is to juice existing GMV for more revenue - hence the continued upward pressure on take rate.
Marketplaces are hard businesses to build and scale. They require double the work to acquire buyers and sellers. On top of that they need perfect matching - right time, right place, right product, right price. With so many variables, marketplaces inevitably hit a plateau. Sometimes due to competition. Sometimes due to market saturation, inefficient supply / demand acquisition, or shifting consumer preferences. No matter the reason, it’s important to go back to distill the marketplace to its core marketplace equation. Identify the four key levers and you have the blueprint for how to optimize and grow out of any plateau.
1) My research suggests that Jeff Bezos announced the "35% sales from cross selling" detail in an interview in 2006. Found lots of secondary sources referring to this interview, but all primary links were dead.